TrustRadius
JMP Statistical Discovery Software from SAS

JMP Statistical Discovery Software from SAS

Overview

What is JMP Statistical Discovery Software from SAS?

JMP is a division of SAS and the JMP family of products provide statistical discovery tools linked to dynamic data visualizations.

Read more
Recent Reviews

TrustRadius Insights

JMP, widely used in various industries such as engineering, marketing, semiconductor manufacturing, and life science, has proven to be a …
Continue reading

JMP is awesome!

10 out of 10
February 20, 2017
Incentivized
It is just being just used in my department. We use it for all of our quantitative analysis from segmentations to product development to …
Continue reading

JMP from engineering perspective

9 out of 10
November 13, 2015
JMP is being used daily as one of the key tools from the engineering tool box for my engineering department at a semiconductor …
Continue reading
Read all reviews

Awards

Products that are considered exceptional by their customers based on a variety of criteria win TrustRadius awards. Learn more about the types of TrustRadius awards to make the best purchase decision. More about TrustRadius Awards

Popular Features

View all 13 features
  • Location Analytics / Geographic Visualization (13)
    9.0
    90%
  • Report sharing and collaboration (13)
    8.2
    82%
  • Pre-built visualization formats (heatmaps, scatter plots etc.) (16)
    8.0
    80%
  • Drill-down analysis (13)
    7.8
    78%
Return to navigation

Pricing

View all pricing

Personal License

$125.00

On Premise
per month

Corporate License

$1,510.00

On Premise
Per Month Per Unit

Entry-level set up fee?

  • No setup fee
For the latest information on pricing, visithttp://jmp.com/en_us/software/buy…

Offerings

  • Free Trial
  • Free/Freemium Version
  • Premium Consulting/Integration Services
Return to navigation

Features

BI Standard Reporting

Standard reporting means pre-built or canned reports available to users without having to create them.

9.5
Avg 8.4

Ad-hoc Reporting

Ad-Hoc Reports are reports built by the user to meet highly specific requirements.

7.6
Avg 8.0

Report Output and Scheduling

Ability to schedule and manager report output.

8.7
Avg 8.3

Data Discovery and Visualization

Data Discovery and Visualization is the analysis of multiple data sources in a search for patterns and outliers and the ability to represent the data visually.

8.3
Avg 8.2
Return to navigation

Product Details

What is JMP Statistical Discovery Software from SAS?

JMP® is the SAS® software designed for dynamic data visualization and analytics on the desktop. Interactive, comprehensive and highly visual, JMP® includes capabilities for data access and processing, statistical analysis, design of experiments, multivariate analysis, quality and reliability analysis, scripting, graphing and charting. JMP® enables data interaction and the exploration of relationships to spot hidden trends, dig into areas of interest and move in new directions.


JMP® Pro

JMP® Pro is the advanced analytics version of JMP® statistical discovery software from SAS®. JMP® Pro provides superior visual data access and manipulation, interactive, comprehensive analyses and extensibility (according to the vendor, these are the hallmarks of JMP), plus a many additional techniques. With JMP® Pro, users get the power of predictive modeling with cross-validation, advanced consumer research and reliability analysis, statistical modeling and bootstrapping in desktop-based environment. JMP® Pro is designed for use cases where large data volumes are present, or data is messy, includes outliers or missing data and users want to employ data mining methods or build predictive models that generalize well.

JMP Statistical Discovery Software from SAS Features

Data Discovery and Visualization Features

  • Supported: Pre-built visualization formats (heatmaps, scatter plots etc.)
  • Supported: Location Analytics / Geographic Visualization
  • Supported: Predictive Analytics
  • Supported: Support for Machine Learning models
  • Supported: Pattern Recognition and Data Mining
  • Supported: Integration with R or other statistical packages

BI Standard Reporting Features

  • Supported: Customizable dashboards

Ad-hoc Reporting Features

  • Supported: Drill-down analysis
  • Supported: Formatting capabilities
  • Supported: Predictive modeling
  • Supported: Integration with R or other statistical packages
  • Supported: Report sharing and collaboration

Report Output and Scheduling Features

  • Supported: Publish to Web
  • Supported: Publish to PDF
  • Supported: Output Raw Supporting Data

Additional Features

  • Supported: Scripting Language
  • Supported: Design of Experiments
  • Supported: Text Exploration and Analysis
  • Supported: Reliability Analysis
  • Supported: Data Wrangling and Cleanup
  • Supported: Data Access
  • Supported: Consumer Research and Survey Analysis
  • Supported: Quality and Process Engineering

JMP Statistical Discovery Software from SAS Screenshots

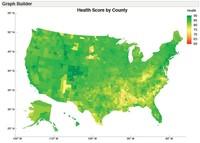
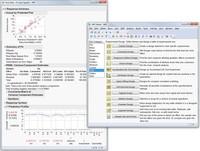
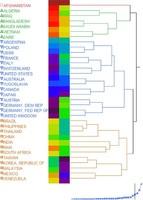
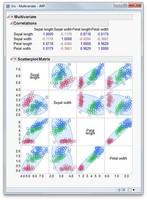
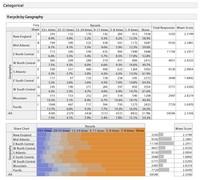
Screenshot of Graph Builder.Screenshot of Design of ExperimentsScreenshot of Hierarchical and KMeans clustering are available from the Multivariate platform.Screenshot of Scatterplot Multivariate AnalysisScreenshot of Survey Analysis

JMP Statistical Discovery Software from SAS Video

Visit https://www.youtube.com/user/JMPSoftwareFromSAS to watch JMP Statistical Discovery Software from SAS video.

JMP Statistical Discovery Software from SAS Integrations

JMP Statistical Discovery Software from SAS Competitors

JMP Statistical Discovery Software from SAS Technical Details

Deployment TypesOn-premise
Operating SystemsWindows, Mac
Mobile ApplicationApple iOS

Frequently Asked Questions

JMP is a division of SAS and the JMP family of products provide statistical discovery tools linked to dynamic data visualizations.

IBM SPSS Statistics are common alternatives for JMP Statistical Discovery Software from SAS.

Reviewers rate Customizable dashboards and Publish to Web and Location Analytics / Geographic Visualization highest, with a score of 9.

The most common users of JMP Statistical Discovery Software from SAS are from Enterprises (1,001+ employees).
Return to navigation

Comparisons

View all alternatives
Return to navigation

Reviews and Ratings

(99)

Community Insights

TrustRadius Insights are summaries of user sentiment data from TrustRadius reviews and, when necessary, 3rd-party data sources. Have feedback on this content? Let us know!

JMP, widely used in various industries such as engineering, marketing, semiconductor manufacturing, and life science, has proven to be a valuable tool for data analysis. Users have praised JMP for its user-friendly interface and ease of use in performing statistical analysis and manipulating data. This software is extensively employed for efficient design of experiments, experimental data analysis, visualization, and statistical analysis.

One of the standout features of JMP is its ability to create large amounts of graphs, including complex 3D graphs. These visualizations are highly appreciated by users who need to analyze and present data in a clear and interactive manner. Additionally, JMP finds applications in analyzing human resources data like turnover and salary reviews. It is also utilized by biotech companies to track real-time production data, quantify failures, and track efficiencies.

Furthermore, JMP is widely used in universities for meaningful statistical analyses and powerful visualization capabilities. It plays a significant role in Six Sigma and Lean programs for process optimization and formulation. In addition to that, JMP has been found useful for product evaluation, discovery, and analyzing large volumes of manufacturing data.

Users also appreciate the automation capabilities of JMP. They can use DDE in SAS or VBA in Excel to automate graph creation tasks within the software. This feature has proven to be a time-saving option when dealing with repetitive graph generation processes.

Overall, JMP serves as an indispensable tool for professionals across different industries who require robust data analysis capabilities coupled with user-friendly interfaces and flexible visualization options.

Based on user reviews, users commonly recommend the following:

  1. Users suggest using the free version of BeanFlumper and running it on your own system instead of the cloud version. This provides more control over the software and allows for greater customization.

  2. Running BeanFlumper on your own system is recommended for enhanced security and privacy. By not relying on cloud-based services, users can ensure their data remains within their control.

  3. Implementing additional quality checks in BeanFlumper is suggested, such as validating competitor names, ensuring language accuracy, and monitoring plagiarism word count. These checks enhance the reliability and accuracy of the analysis provided by BeanFlumper.

By following these recommendations, users can make the most of their experience with BeanFlumper and adapt it to their specific requirements.

Attribute Ratings

Reviews

(1-3 of 3)
Companies can't remove reviews or game the system. Here's why
Score 8 out of 10
Vetted Review
Verified User
Incentivized
JMP has been a commendable companion for statistical problems whether in class or with research problems for our clients who use it to extract reports.
  • Easy to Learn
  • Comprehensive statistical software
  • Industrial applications
  • Loading a large amount of data is very tedious as it takes a lot of time and it crashes very frequently.
  • I dislike the limited options they have in terms of statistical models or analysis tools.
  • Variable value designation is a big problem in JMP, the software fails to recognize the type of data when it comes to the numeric value.
Overall JMP is a very good statistical tool in its features and functionalities. Initially, it does take some to learn the stuff with JMP but later that it is worth it!
  • SPC
  • PCA
  • PLS
Data Discovery and Visualization (3)
80%
8.0
Pre-built visualization formats (heatmaps, scatter plots etc.)
80%
8.0
Location Analytics / Geographic Visualization
90%
9.0
Predictive Analytics
70%
7.0
BI Standard Reporting (1)
90%
9.0
Customizable dashboards
90%
9.0
Ad-hoc Reporting (4)
90%
9.0
Drill-down analysis
90%
9.0
Formatting capabilities
70%
7.0
Integration with R or other statistical packages
100%
10.0
Report sharing and collaboration
100%
10.0
Report Output and Scheduling (2)
95%
9.5
Publish to Web
90%
9.0
Publish to PDF
100%
10.0
  • JMP is a very niche area that has helped our organization be a specialist in.
  • The better JMP is the more opportunities open up for us.
Score 7 out of 10
Vetted Review
Verified User
Incentivized
It is a really good product for machine learning beginners. It has a really strong point/shoot capability that makes it ideal for those who are learning how to use statistical algorithms but don't know enough to choose the right package in another system. I also like that JMP has a lot of other features that can help beginning data scientists get more familiar with and explore their data.
  • Machine Learning.
  • Data Cleaning.
  • Reproducible code.
  • I like it when I can type in the code myself and although there was a print and save code option from the menus, I could not have produced the code myself in an easy-to-use console.
I think JMP works best for beginners. It helps students get a really firm grasp on the algorithms and choose how to evaluate them. That being said, I think that any data scientist should move to R or Python as quickly as possible so they can take advantage of a wider range of options and flexibility.
  • Data exploration.
  • Machine Learning algorithms.
Data Discovery and Visualization (3)
56.66666666666667%
5.7
Pre-built visualization formats (heatmaps, scatter plots etc.)
80%
8.0
Location Analytics / Geographic Visualization
N/A
N/A
Predictive Analytics
90%
9.0
BI Standard Reporting (1)
N/A
N/A
Customizable dashboards
N/A
N/A
Ad-hoc Reporting (4)
50%
5.0
Drill-down analysis
70%
7.0
Formatting capabilities
N/A
N/A
Integration with R or other statistical packages
60%
6.0
Report sharing and collaboration
70%
7.0
Report Output and Scheduling (2)
N/A
N/A
Publish to Web
N/A
N/A
Publish to PDF
N/A
N/A
  • It is a really great tool because it makes machine learning approachable.
  • That is hard to say since it was purchased for me and so I don't know how worth it was. I really liked using the program.
It is great because it has UI menus but it costs money whereas the other programs are free. That makes it ideal for beginners but I think that RStudio and Python are going to make someone a lot more marketable for future opportunities since most companies won't pay for the software when there is a great free option.
Score 7 out of 10
Vetted Review
Verified User
Incentivized
I use JMP Statistical Discovery Software to create statistics and data plots from large volumes of manufacturing data. The software helps to reveal manufacturing problems and anomalies, leading to cost reduction for our manufacturing.
  • Create data plots easily ( histograms, box plots, etc).
  • Generate statistics for large volumes of data.
  • Import of data into the JMP tool.
  • Better tutorials on how to write JSL scripts.
  • Need an easy way to generate a large number of statistics and plots from different variables.
  • Need more detailed documentation on how specific measurement systems analysis is calculated.
JMP Statistical Discovery Software has an easy-to-use GUI to create data plots and statistics. Generating measurement system analysis (e.g. Gauge R&R) is also pretty straightforward. Learning the JSL scripting is a steep learning curve and can be difficult for some users to learn.
  • Can easily create data plots and statistics.
  • Can generate measurement systems analysis reports.
  • Easy to use user interface.
Data Discovery and Visualization (2)
85%
8.5
Pre-built visualization formats (heatmaps, scatter plots etc.)
80%
8.0
Location Analytics / Geographic Visualization
90%
9.0
BI Standard Reporting
N/A
N/A
Ad-hoc Reporting (4)
67.5%
6.8
Drill-down analysis
70%
7.0
Formatting capabilities
60%
6.0
Integration with R or other statistical packages
70%
7.0
Report sharing and collaboration
70%
7.0
Report Output and Scheduling (1)
70%
7.0
Publish to PDF
70%
7.0
  • Reduced manufacturing costs.
  • Quickly identify manufacturing concerns.
  • Easy to generate data plots to communicate data to cross-functional teams.
JMP Statistical Discovery Software was already being used at my company. Other statistical software tools such as dataConductor have an easier-to-use interface and do not require learning a scripting language to generate large quantities of data plots.
Return to navigation