TrustRadius
Spotfire

Spotfire

Overview

What is Spotfire?

Spotfire, formerly known as TIBCO Spotfire, is a visual data science platform that combines visual analytics, data science, and data wrangling, so users can analyze data at-rest and at-scale to solve complex industry-specific problems.

Read more

Learn from top reviewers

Video Reviews

1 video

TIBCO Spotfire Review: Translates Data To Be Visualized For More Effective Understanding
02:38
Return to navigation

Pricing

View all pricing

Spotfire for Amazon Web Services

$0.99

Cloud
Per Hour (Starting)

Spotfire Cloud - Consumer

$250/yr

Cloud
per seat

Spotfire Cloud - Business Author

$650/yr

Cloud
per seat

Entry-level set up fee?

  • No setup fee
For the latest information on pricing, visithttp://spotfire.tibco.com/products/comp…

Offerings

  • Free Trial
  • Free/Freemium Version
  • Premium Consulting/Integration Services
Return to navigation

Product Demos

Spotfire Analytics Interactive Demos

www.spotfire.com
Return to navigation

Features

Platform Connectivity

Ability to connect to a wide variety of data sources

7.3
Avg 8.3

Data Exploration

Ability to explore data and develop insights

9.1
Avg 8.3

Data Preparation

Ability to prepare data for analysis

7.4
Avg 8.2

Platform Data Modeling

Building predictive data models

7.6
Avg 8.4

Model Deployment

Tools for deploying models into production

7.4
Avg 8.5
Return to navigation

Product Details

What is Spotfire?

Spotfire® is a data visualization platform that aims to speed individual time to insight and spur analytics adoption across the organization. According to the vendor, Spotfire helps users quickly and easily generate insights with three new ways to support their analytical preferences: NLQ powered search, AI-driven recommendations, and direct manipulation. Users can add context with native streaming for integrated analyses of real-time and historical data, best-in-class geoanalytics, and one-click predictive analytics to go beyond basic visualizations and understand the factors driving trends and what will happen next.

The vendor states Spotfire's differentiating hybrid in-memory/in-database analytics architecture supports the most demanding enterprise needs, scaling to thousands of users and limitless rows of data.

Spotfire is deployed in companies in financial services, energy, manufacturing, consumer packaged goods, government, travel & logistics, helathcare, and life sciences.

Spotfire® is a business unit of Cloud Software Group, formerly known as TIBCO Spotfire.

Spotfire Screenshots

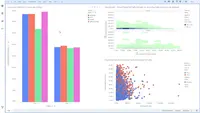
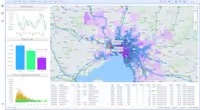
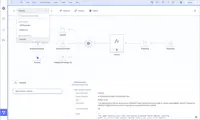
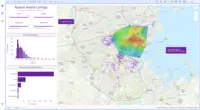
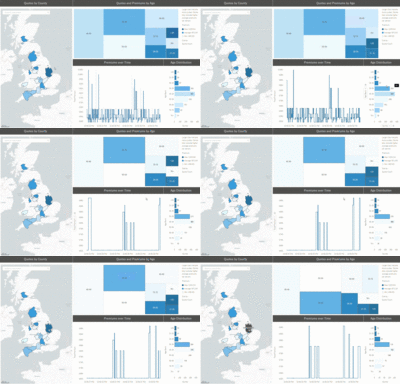
Screenshot of Smart Visual AnalyticsScreenshot of Geospatial AnalyticsScreenshot of Intelligent Data WranglingScreenshot of Point-and-click Data ScienceScreenshot of Real-time Streaming Analytics

Spotfire Videos

Intro to Visualizations in Spotfire
Creating a Dashboard in 5 Minutes
Spotfire Application Walkthrough
Advanced Analytics Scripting with Python and R

Spotfire Technical Details

Deployment TypesOn-premise, Software as a Service (SaaS), Cloud, or Web-Based
Operating SystemsWindows, Linux, Mac
Mobile ApplicationApple iOS, Mobile Web
Supported CountriesAvailable in all regions
Supported LanguagesEnglish, Spanish, French, German, Portugese, Chinese, Italian

Frequently Asked Questions

Spotfire, formerly known as TIBCO Spotfire, is a visual data science platform that combines visual analytics, data science, and data wrangling, so users can analyze data at-rest and at-scale to solve complex industry-specific problems.

Tableau Desktop, QlikView, and Microsoft Power BI are common alternatives for Spotfire.

Reviewers rate Interactive Data Analysis highest, with a score of 9.2.

The most common users of Spotfire are from Enterprises (1,001+ employees).
Return to navigation

Comparisons

View all alternatives
Return to navigation

Reviews From Top Reviewers

Companies can't remove reviews or game the system. Here's why
(1-5 of 343)

Powerful and flexible software for analyzing large multi-parameter data sets.

Rating: 9 out of 10
October 31, 2017
Vetted Review
Verified User
Spotfire
1 year of experience
The software is very powerful and useful for in depth analysis of large volumes of data. It has multiple ways of visualizing and filtering data that helps to identify trends which are not visible in raw data. Spotfire is somewhat similar to MS Excel and compatible with it but has much greater flexibility and data visualizing power.
  • Data filtering is useful for customizing data sets.
  • Multiple types of flexible visualizations help to discover important trends.
  • Flexible data export function helps efficiently express the results.
Cons
  • Learning curve is rather steep.
  • Some mutually-related functions and features can be grouped to make the software more intuitive.
  • Pop-up hints may be useful especially for beginner users.

It is particularly useful for large multi-parameter data sets where trends are obscure.

It is less appropriate for small or relatively simple data sets.

Transfom different format data sets and external sources data to dashboards in a blink of an eye.

Rating: 8 out of 10
June 20, 2018
Vetted Review
Verified User
Spotfire
2 years of experience
Currently, there are multiple departments from different divisions and directorates that are using Spotfire. Most of them are using the product mainly for aggregating data and visualizing them into dashboards. Next major use case of Spotfire is for displaying Geographical Information such as building heatmaps and mobility patterns. However, we are also exploring Spotfire's analytical capabilities for descriptive and predictive analytics.
  • Aggregating data and presents them in dynamic charts.
  • Descriptive analytics and patterns discovery.
Cons
  • High-dimensionality data source
  • Near real-time analytics
Spotfire is perfect for simplifying (preprocessed/cleaned) data aggregation, performing descriptive analytics, and visualization of information in dynamic charts or augment information with geographical information in maps. However, sometimes it might have some problems when trying to handle incomplete data set with a couple of fields containing some null or empty values.

Spotfire

Rating: 3 out of 10
February 08, 2019
BD
Vetted Review
Verified User
Spotfire
3 years of experience
Departmental use for analyzing biotech research data.
  • Cloud deployment makes data accessible anywhere.
  • Ability to customize and save visualization formats/templates is very useful.
  • Joining data from multiple tables is simplified in Spotfire vs other platforms.
Cons
  • Initial setup of our Team account was very painful.
Spotfire is good for visualizing complete data sets and for joining incomplete data sets for visualization. However, we struggle when mathematical manipulations are required prior to visualizing the data. We find ourselves going to Excel, crunching the numbers, and sending a CSV back to Spotfire.

Spotfire review: chemistry centric

Rating: 8 out of 10
March 08, 2019
Vetted Review
Verified User
Spotfire
25 years of experience
I am a freelance chemistry consultant serving clients in the biotechnology/pharmaceuticals industry. Prior to this I was in big pharma for 20+ years and used Spotfire for data analysis and visualization. We have complex datasets and Spotfire allowed us to analyze components and look for trends. There are other programs that will do this, but Spotfire has a chemically intelligent add-in that allows chemical structures to be linked to data. This is a critical component for my specialty, so I continue to use this to assist my clients with their data analysis needs.
  • Importing and exporting of large datasets is very fast, as is manipulation of the data within Spotfire. Other programs I have used don't do this as well.
  • Data visualization is extremely powerful and fairly intuitive to set up—there are multiple ways to view and organize data. Additionally, the statistical analysis and clustering capabilities are powerful and fairly straightforward to use.
  • The export function into Microsoft Products is nice, allows easy loading into static presentations.
Cons
  • Like most very powerful software programs there are parts of Spotfire that are not intuitive to use. While the help function inside Spotfire is useful—I like the fact that the help function is not just a static .pdf file, but has index/search capabilities. It doesn't cover everything, and sometimes getting data into Spotfire can be a challenge. For example, adding and combining data is not always a simple process depending on the data source
  • I have rarely tried to use the Spotfire support team so this is a small sample size, but I have not been impressed with their response time or customer assistance when I have used them.
  • This is a specialized piece, but calculating and inserting chemical properties in a compound table can be slow in Spotfire if the data set is large. I have used other chemically-intelligent data visualization programs where calculated properties are done much faster.
SpotFire is well-suited for the visualization and analysis of complex data sets and situations where that is needed fairly frequently. If you have small data sets or do not need sophisticated visualization graphics, it may be "overpowered" for your situation. It takes some training to be able to use it well and unlock the full power of the program.

Satisfied with Spotfire

Rating: 10 out of 10
July 10, 2017
BR
Vetted Review
Verified User
Spotfire
3 years of experience
At Tapstone, Spotfire is primarily used to quickly visualize and amalgamate data used by other programs or from Excel documents that is stored in bulky table formats that are not optimally useful in their raw state. Spotfire aids in our ability to quickly summarize data into useful information, and point us in the direction of a useful drill down.
  • Spotfire's marking capibilities on line charts make it very easy to identify associated points on cluttered line graphs.
  • Spotfire's filtering makes it very easy to boil analyses down to specific subsets of data, and then build them back up to whole again.
  • Spotfire has the capability to link to many different data sources, making it relatively easy to keep an analysis up to date by linking to a live data source.
Cons
  • As an Excel user, it is an odd transition to shift from thinking in terms of cells to thinking in terms of tables and columns. Some things that would be intuitively easy with Excel (adding 4 random cells from a document by clicking on each of the 4 cells) become much more complicated when you have to think in terms rows and tables only.
  • When linking multiple live data sources together, then adding calculated columns to those data sources, then moving columns from one data table to another in one project, Spotfire can take a long time to open a project. It is also relatively easy to end up with a document that does not calculate the intended results in the most efficient way, and methods to troubleshoot inefficiencies are not always immediately obvious.
  • Scatter plot line formatting could be more customizable. By default, Spotfire wants to use the same line type for each series in a scatter plot, and it is not easy for this user to figure out if there is a way to change line types per series on a chart.
I would definitely recommend Spotfire to a colleague that has a large set of raw data and wants to quickly consolidate that set of data into meaningful graphs or charts - especially if the data as a whole is likely to bring up questions that could be addressed by drilling deeper into more specific categories of data. It also appears to be especially useful for keeping somewhat repetitive and common analyses live and quickly accessible.
Return to navigation