Tableau Desktop vs. Toucan
Tableau Desktop vs. Toucan
| Product | Rating | Most Used By | Product Summary | Starting Price |
|---|---|---|---|---|
 Tableau Desktop | N/A | Tableau Desktop is a data visualization product from Tableau. It connects to a variety of data sources for combining disparate data sources without coding. It provides tools for discovering patterns and insights, data calculations, forecasts, and statistical summaries and visual storytelling. | $75 per month | |
 Toucan | N/A | Toucan Toco, from the company of the same name headquartered in France, is an embedded BI solution that communicates contextualised and actionable insights to untrained business users, no matter their data literacy levels or device used, and without the need for training, coding or design skills, or hardware requirements. | N/A |
| Tableau Desktop | Toucan | |||||||||||||||
|---|---|---|---|---|---|---|---|---|---|---|---|---|---|---|---|---|
| Editions & Modules |
| No answers on this topic | ||||||||||||||
| Offerings |
| |||||||||||||||
| Entry-level Setup Fee | No setup fee | Optional | ||||||||||||||
| Additional Details | All pricing plans are billed annually. | — | ||||||||||||||
| More Pricing Information | ||||||||||||||||
| Tableau Desktop | Toucan |
|---|
| Tableau Desktop | Toucan | |||||||||||||||||||||
|---|---|---|---|---|---|---|---|---|---|---|---|---|---|---|---|---|---|---|---|---|---|---|
| BI Standard Reporting |
| |||||||||||||||||||||
| Ad-hoc Reporting |
| |||||||||||||||||||||
| Report Output and Scheduling |
| |||||||||||||||||||||
| Data Discovery and Visualization |
| |||||||||||||||||||||
| Access Control and Security |
| |||||||||||||||||||||
| Mobile Capabilities |
| |||||||||||||||||||||
| Application Program Interfaces (APIs) / Embedding |
|
| Tableau Desktop | Toucan | |
|---|---|---|
| Small Businesses |  Yellowfin Score 8.8 out of 10 | Yellowfin Score 8.8 out of 10 |
| Medium-sized Companies |  Reveal Score 10.0 out of 10 | Reveal Score 10.0 out of 10 |
| Enterprises |  Kyvos Semantic Layer Score 9.5 out of 10 |  Infor Birst Score 6.3 out of 10 |
| All Alternatives | View all alternatives | View all alternatives |
| Tableau Desktop | Toucan | |
|---|---|---|
| Likelihood to Recommend | 8.6 (204 ratings) | 7.0 (1 ratings) |
| Likelihood to Renew | 7.5 (41 ratings) | - (0 ratings) |
| Usability | 8.2 (73 ratings) | - (0 ratings) |
| Availability | 10.0 (11 ratings) | - (0 ratings) |
| Performance | 8.0 (10 ratings) | - (0 ratings) |
| Support Rating | 1.0 (57 ratings) | 10.0 (1 ratings) |
| In-Person Training | 9.4 (4 ratings) | - (0 ratings) |
| Online Training | 8.0 (5 ratings) | - (0 ratings) |
| Implementation Rating | 8.0 (34 ratings) | - (0 ratings) |
| Configurability | 7.0 (3 ratings) | - (0 ratings) |
| Ease of integration | 10.0 (1 ratings) | - (0 ratings) |
| Product Scalability | 9.0 (4 ratings) | - (0 ratings) |
| Vendor post-sale | 10.0 (1 ratings) | - (0 ratings) |
| Vendor pre-sale | 10.0 (1 ratings) | - (0 ratings) |
| Tableau Desktop | Toucan | |
|---|---|---|
| Likelihood to Recommend |  Tableau
 Karol Kozłowski Project manager | Toucan
 Kathleen Paluso Director, Customer Success & Implementation |
| Pros | Tableau
 Afia Tamanna Information Technology Business Consultant | Toucan
Kathleen Paluso Director, Customer Success & Implementation |
| Cons | Tableau
| Toucan
Kathleen Paluso Director, Customer Success & Implementation |
| Likelihood to Renew | Tableau
| Toucan No answers on this topic |
| Usability | Tableau
 Al Mubassir Muin Software Engineer | Toucan No answers on this topic |
| Reliability and Availability | Tableau
 Brad Llewellyn Associate Data Analytics Consultant | Toucan No answers on this topic |
| Performance | Tableau
| Toucan No answers on this topic |
| Support Rating | Tableau
| Toucan
Kathleen Paluso Director, Customer Success & Implementation |
| In-Person Training | Tableau
 Jon Boeckenstedt Associate Vice President | Toucan No answers on this topic |
| Online Training | Tableau
| Toucan No answers on this topic |
| Implementation Rating | Tableau
 David Fickes Decision Sciences - Modeling, Simulation & Analysis | Toucan No answers on this topic |
| Alternatives Considered | Tableau
| Toucan No answers on this topic |
| Scalability | Tableau
| Toucan No answers on this topic |
| Return on Investment | Tableau
| Toucan
Kathleen Paluso Director, Customer Success & Implementation |
| ScreenShots | Toucan Screenshots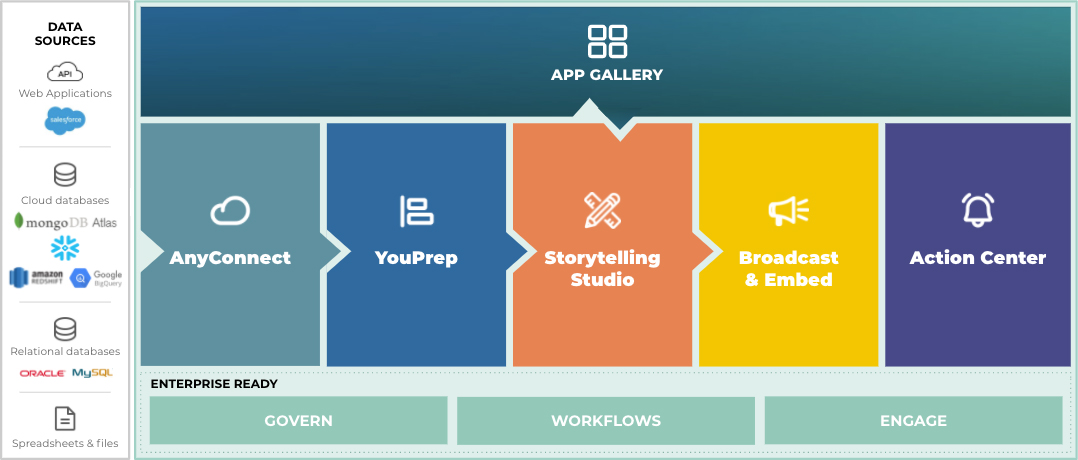   |