Microsoft BI is a business intelligence product used for data analysis and generating reports on server-based data. It features unlimited data analysis capacity with its reporting engine, SQL Server Reporting Services alongside ETL, master data management, and data cleansing.
$9.99
per user/per month
Quantrix
Score 7.4 out of 10
N/A
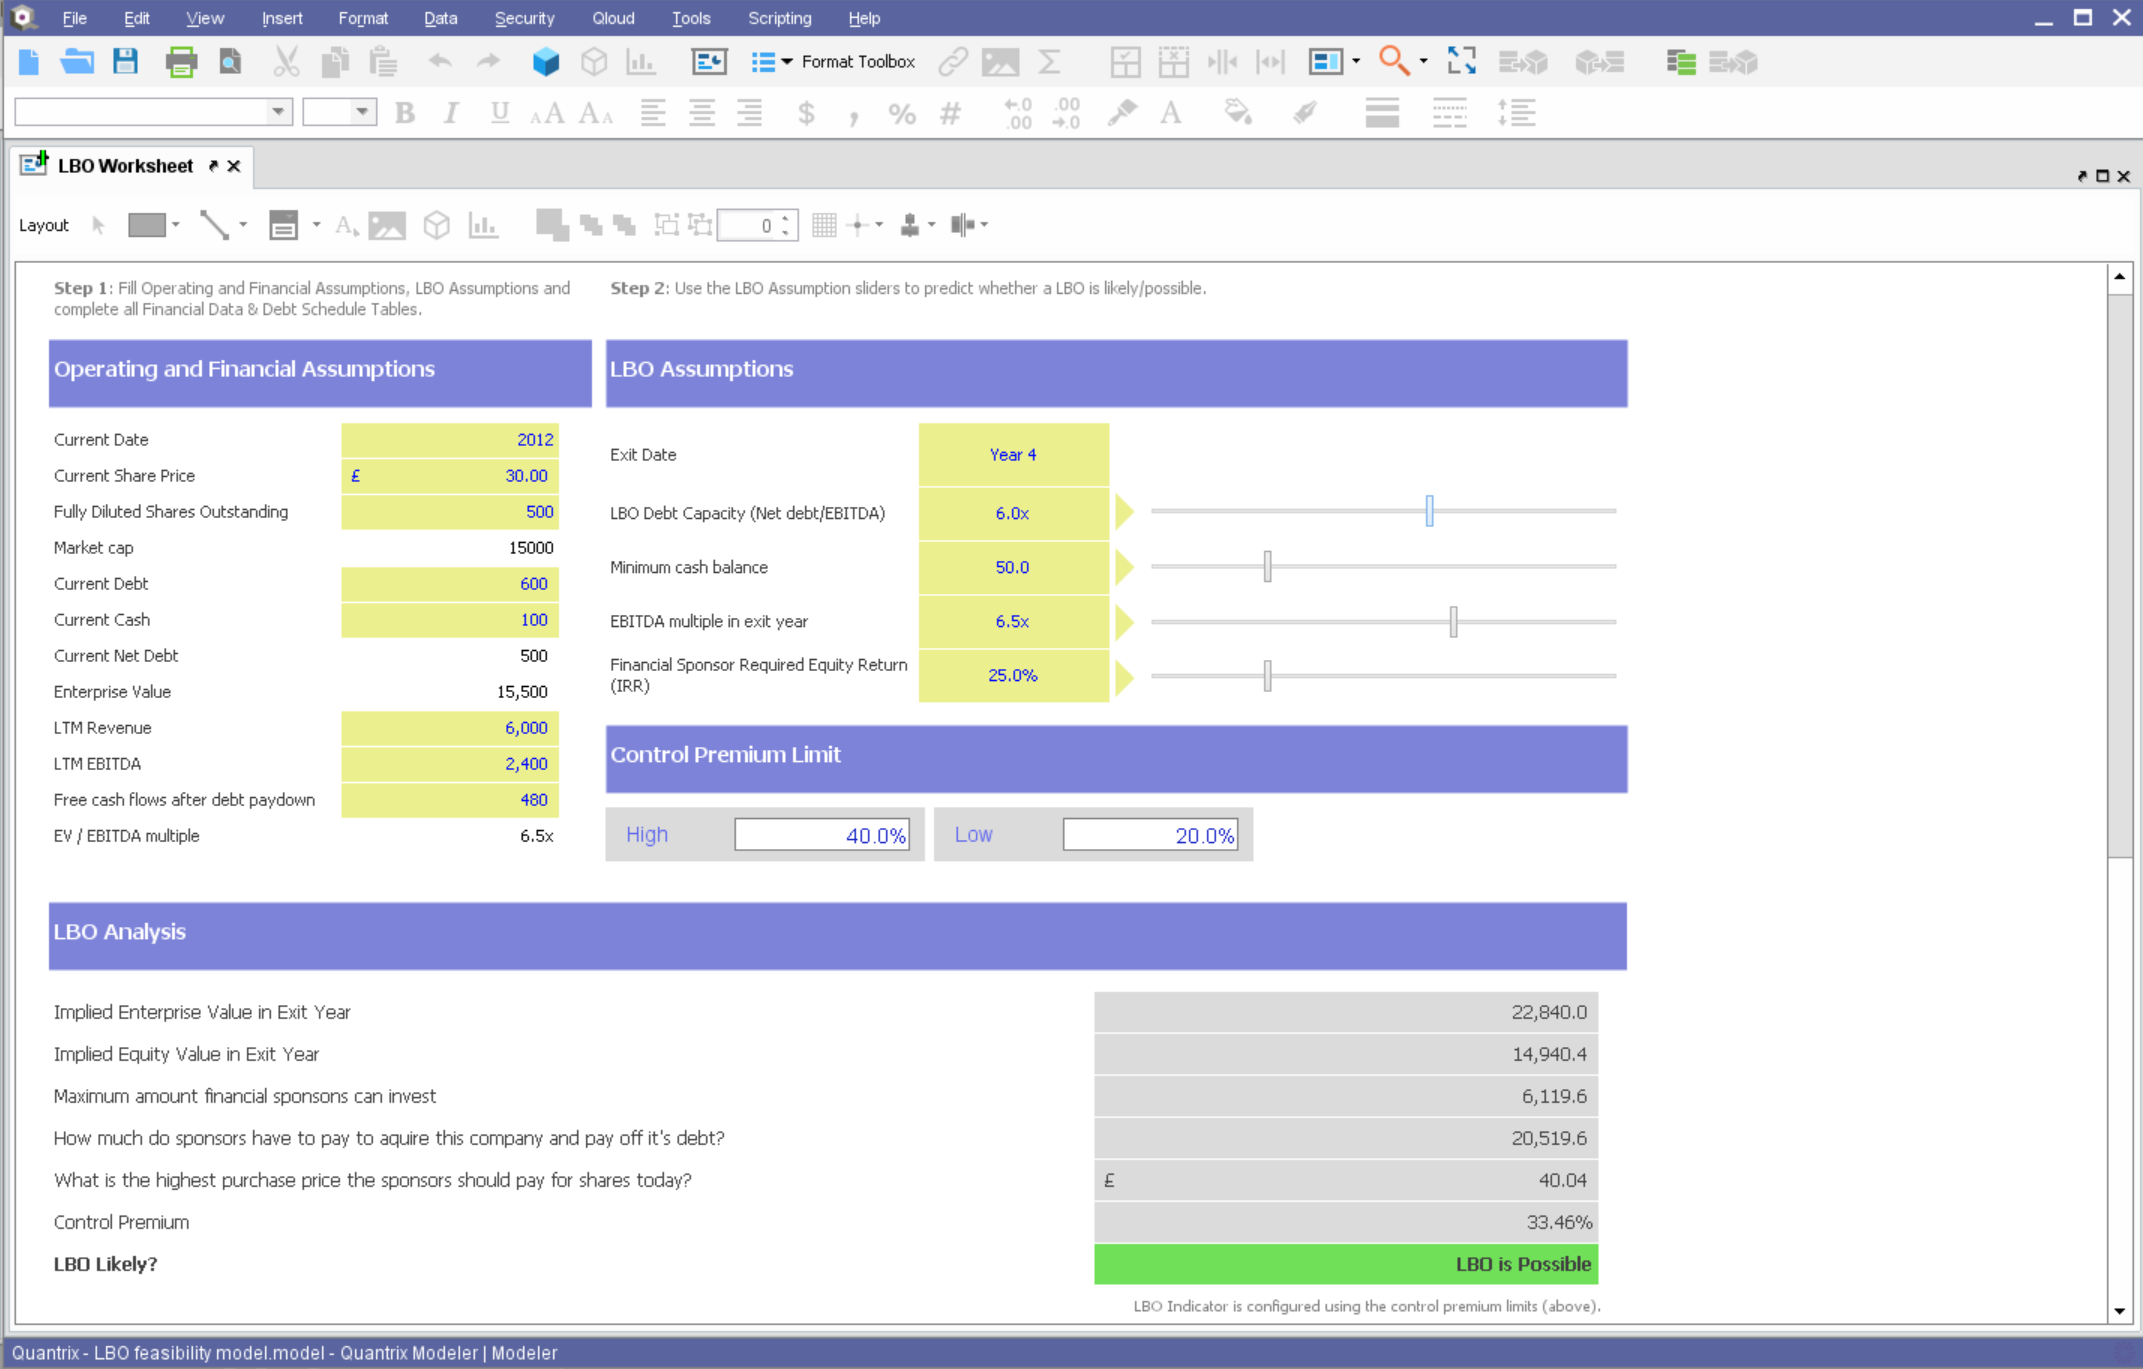
Quantrix is designed to allow users to address the limitations and risks inherent to spreadsheets when developing business-critical models. According to the vendor, this solution offers unmatched capability for forecasting, planning, budgeting, risk modeling and visual analytics, and also allows users to develop ‘what if’ scenarios and model the financial and operational impact of business decisions. Additionally, the vendor says sharing insight is made easier through the creation of interactive…
N/A
Pricing
Microsoft BI (MSBI)
Quantrix
Editions & Modules
Power BI Pro
$9.99
per user/per month
Power BI Premium
4,995
per month
No answers on this topic
Offerings
Pricing Offerings
Microsoft BI (MSBI)
Quantrix
Free Trial
No
Yes
Free/Freemium Version
Yes
No
Premium Consulting/Integration Services
No
Yes
Entry-level Setup Fee
No setup fee
No setup fee
Additional Details
—
Quantrix Modeler is licensed on a per user subscription basis.
Microsoft BI is well suited for Stream analytics, easy data integration, report creation and UI/UX designs (limited but what all available are great ones) Microsoft BI may be less appropriate for handling huge number of datasets and difficult queries. It may also be difficult for a company with heavy data.
If you find yourself in the ocean of traditional spreadsheets, overwhelmed by broken links, errors, model audit problems, hardwiring, etc. here is a lifebuoy for you. If you want to have full flexibility in your budgeting and forecasting in contrast to ERPs with rigid structures and one-size-fits-all concept. If you are small or medium size company and do not want to invest in costly enterprise solutions. If you need a fast implementation https://youtu.be/5W_q5Xhw5fg
Building complex financial planning model availing of a multidimensional data structure coupled with a powerful formula language, with the immediacy and intuitiveness typical of spreadsheets
Implement quickly model modifications (new products, new scenarios, new time periods) simply adding new "items" to "categories" (corresponding to dimensions in a multidimensional data model)
Scale up models to very large datasets with very fast computation times
Easily import data from text files, other Quantrix models and external databases via DataLink and DataNAV
Save snapshots of tables computed in Quantrix to external databases via DataPush
The race to perfect gathering of Non-Traditional datasets is on-going; with Microsoft arguably not the leader of the pack in this category.
Licensing options for PowerBI visualizations may be a factor. I.e. if you need to implement B2C PowerBI visualizations, the cost is considerably high especially for startups.
Some clients are still resistant putting their data on the cloud, which restricts lots of functionality to Power BI.
Hard to be critical of the Quantrix team as I know they strive to produce the best product possible. I suppose the next thing on my wish list would be the application of the new Solver functionality to be available in the Qloud.
A big help for new users would be a good book on transitioning from Excel or other environment into Quantrix. I know first hand it can be difficult to transition when having to learn the program through a help guide, forums and tech support. I had a lot of trial and error in my journey to producing the desired models. On one hand it was a valuable method as it taught me a lot of what not to do, but I will admit it was not the most efficient way to do things.
Would also love to see local user groups being formed at some point in the future. Quantrix puts on a fantastic conference once a year in beautiful Maine, but it is a big journey for someone in Southern California (and limited to one or two days a year). I would like to see some local chapters formed in different areas of the country so local Quantrix users can get together more often and collaborate (maybe a quarterly or semi-annual meetup?). Our Quantrix community is still relatively small and may be a difficult task for some areas, but is also the very reason why this would be great idea.
Microsoft BI is fundamental to our suite of BI applications. That being said, Northcraft Analytics is focused on delighting our customers, so if the underlying factors of our decision change, we would choose to re-write our BI applications on a different stack. Luckily, mathematics are the fundamental IP of our technology... and is portable across all BI platforms for the foreseeable future.
The Microsoft BI tools have great usability for both developers and end users alike. For developers familiar with Visual Studio, there is little learning curve. For those not, the single Visual Studio IDE means not having to learn separate tools for each component. For end-users, the web interface for SSRS is simple to navigate with intuitive controls. For ad-hoc analysis, Excel can connect directly to SSAS and provide a pivot table like experience which is familiar to many users. For database development, there is beginning to be some confusion, as there are now three tool choices (VS, SSMS, Azure Data Studio) for developers. I would like to see Azure Data Studio become the superset of SSMS and eventually supplant it.
SQL Server Reporting Services (SSRS) can drag at times. We created two report servers and placed them under an F5 load balancer. This configuration has worked well. We have seen sluggish performance at times due to the Windows Firewall.
While support from Microsoft isn't necessarily always best of breed, you're also not paying the price for premium support that you would on other platforms. The strength of the stack is in the ecosystem that surrounds it. In contrast to other products, there are hundreds, even thousands of bloggers that post daily as well as vibrant user communities that surround the tool. I've had much better luck finding help with SQL Server related issues than I have with any other product, but that help doesn't always come directly from Microsoft.
I have used on-line training from Microsoft and from Pragmatic Works. I would recommend Pragmatic Works as the best way to get up to speed quickly, and then use the Microsoft on-line training to deep dive into specific features that you need to get depth with.
We are a consulting firm and as such our best resources are always billing on client projects. Our internal implementation has weaknesses, but that's true for any company like ours. My rating is based on the product's ease of implementation.
We have used the built in ConnectWise Manager reports and custom reports. The reports provide static data. PowerBI shows us live data we can drill down into and easily adjust parameters. It's much more useful than a static PDF report.
Overall, I was not part of the ultimate decision to purchase Quantrix. I terms of user-friendliess and robust reporting capabilities I do think Tableau has Quantrix outclassed. That being said, Quantrix does provide more in-depth analyses for our relevant data and provides better modeling for our forecasts out of the box. The accuracy of the tools output is also much better
As a SaaS provider we see being able to provide self-service BI to our client users as a competitive advantage. In fact the MSSQL enabled BI is a contributing factor to many winning RFPs we have done for prospective client organisations.
However MSSQL BI requires extensive knowledge and skills to design and develop data warehouses & data models as a foundation to support business analysts and users to interrogate data effectively and efficiently. Often times we find having strong in-house MSSQL expertise is a bless.
Capacity forecasting used to take hours to calculate with a ton of manual modifications. Quantrix has automated that so a model can be updated at any time with a click of a button
The accuracy of the models is incredible. It took some tweaking to add in data scubbers, but now it runs almost flawlessly
The confidence the management teams have in the output of the model is amazing. Before, people would question the output, have you rebuild it, and then compare. Now the report comes out and the output has high confidence.