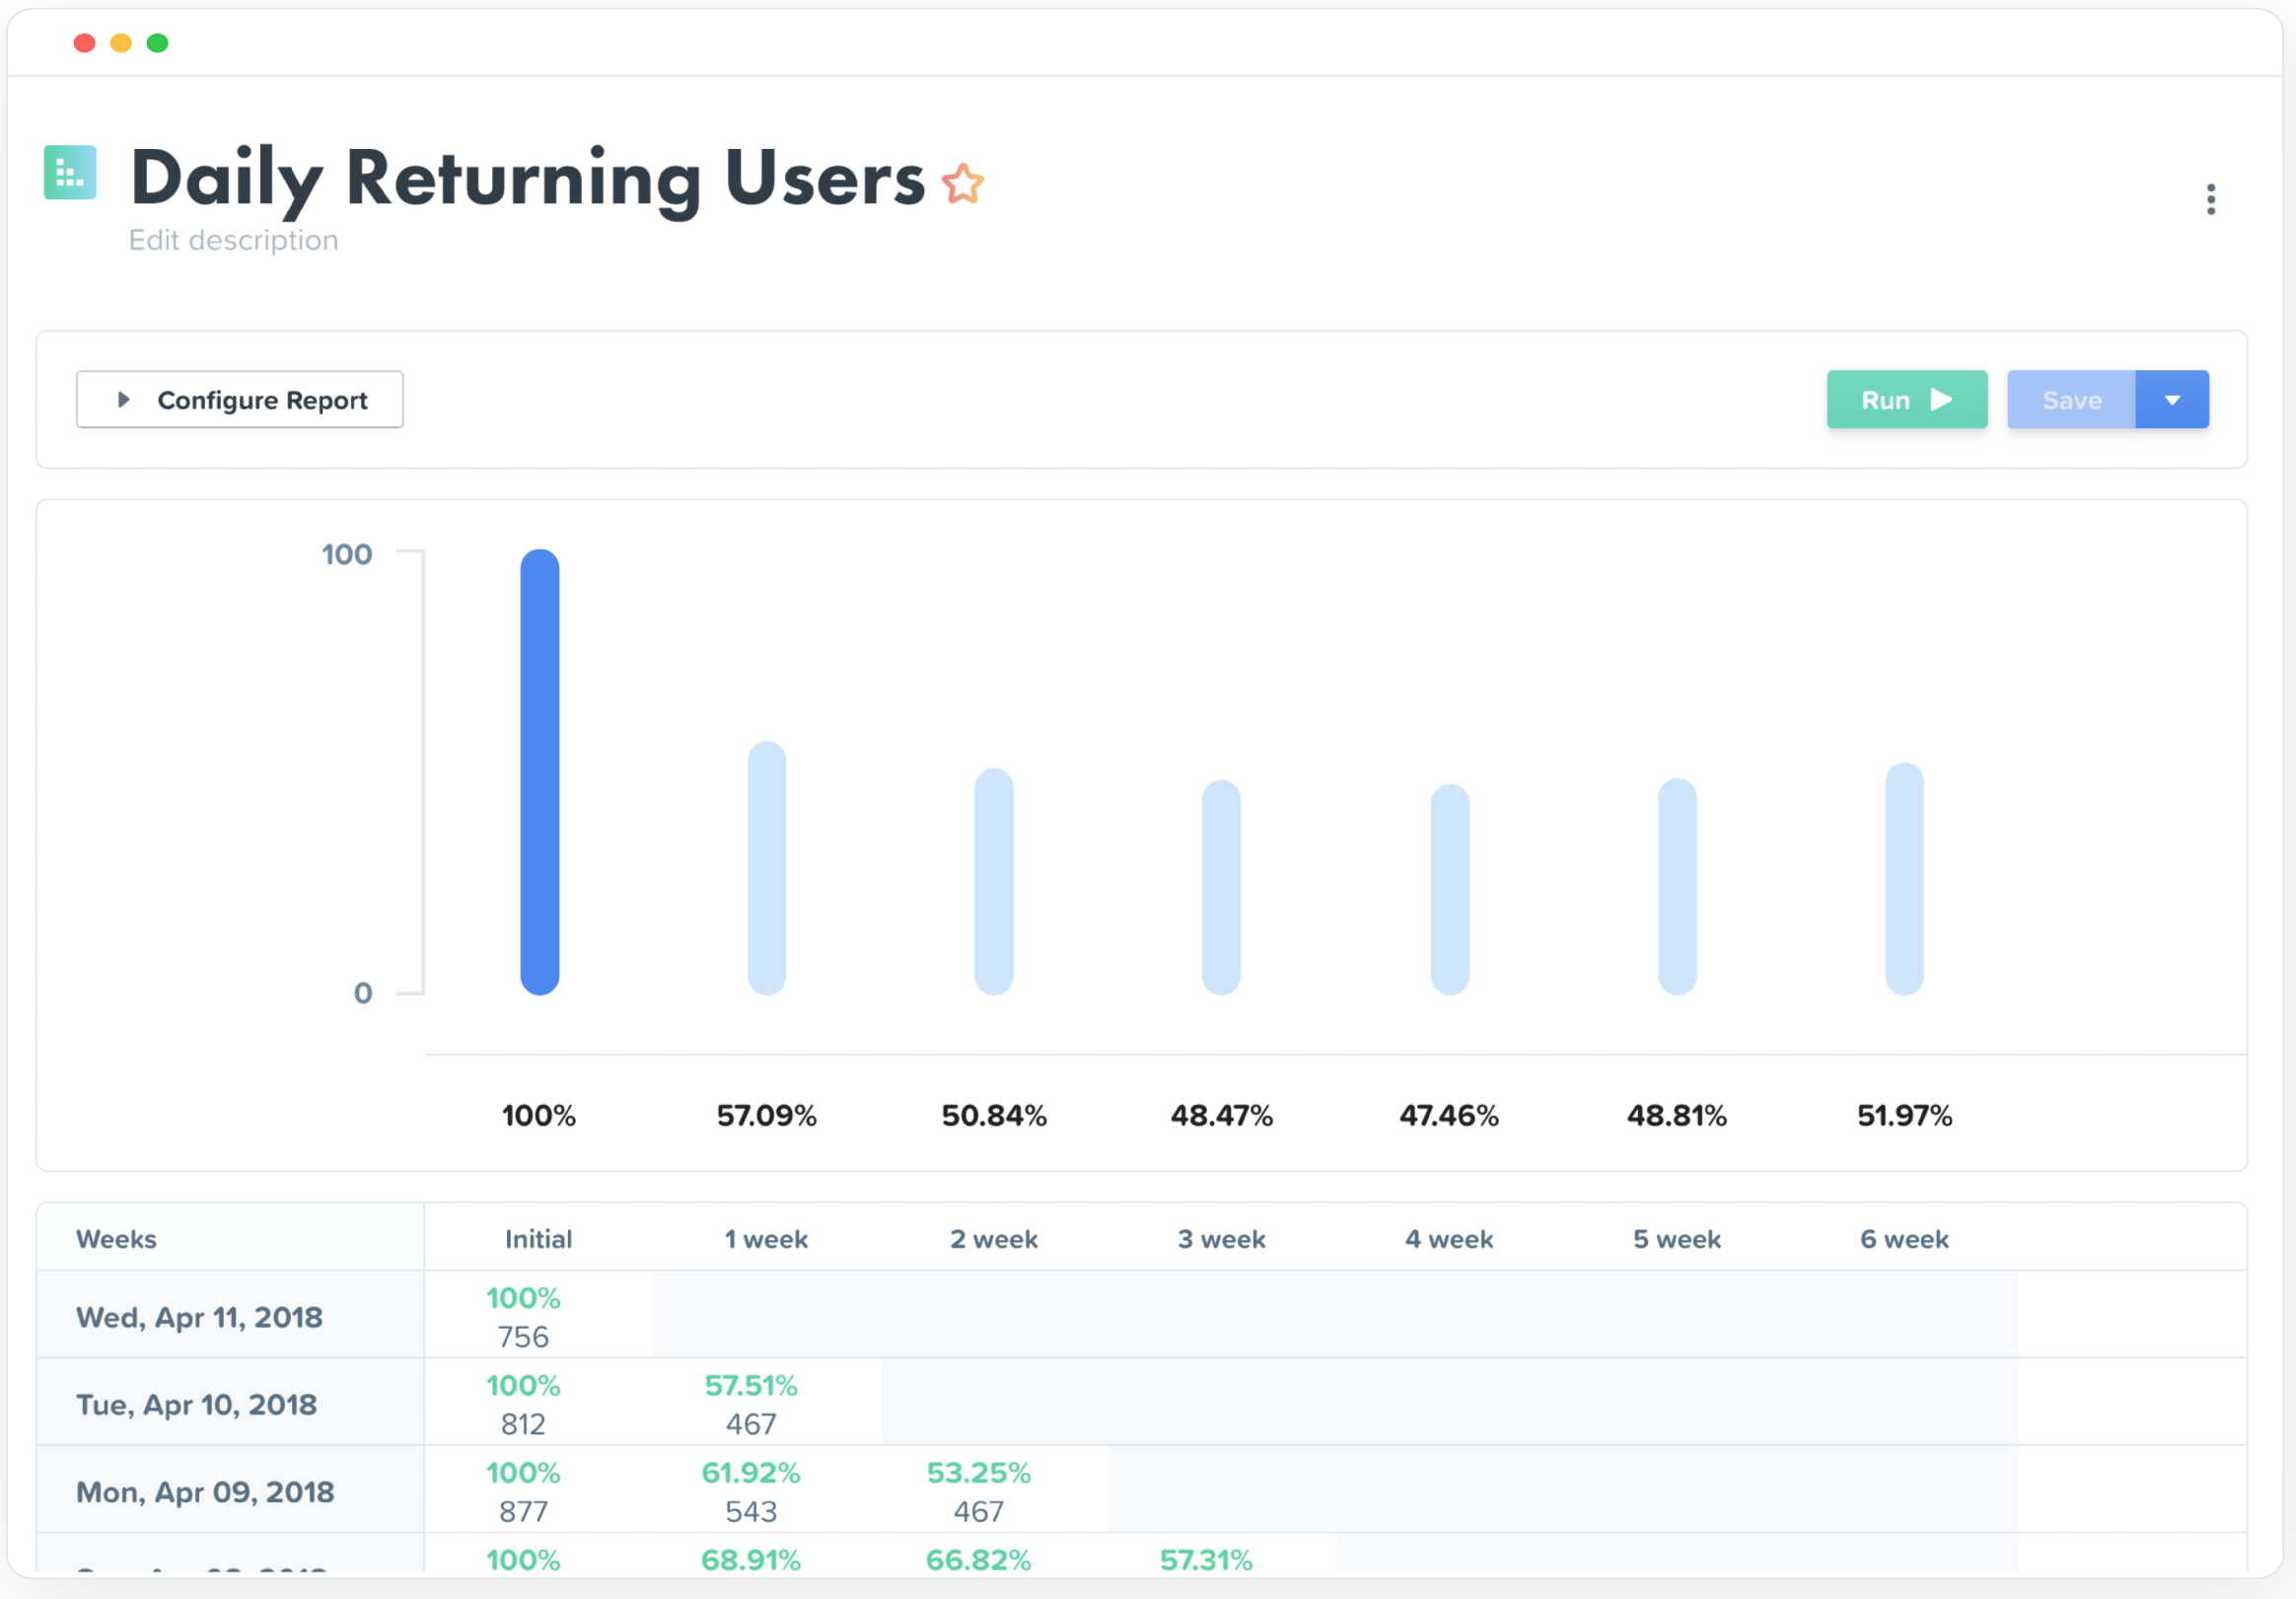
Mixpanel helps companies measure what matters, make decisions fast, and build better products through data. With self-serve product analytics solution, teams can analyze how and why people engage, convert, and retain—in real-time, across devices—to improve their user experience. Mixpanel serves over 26,000 companies from different industries around the world, including Expedia, Uber, Ancestry, DocuSign, and Lemonade. Headquartered in San Francisco, Mixpanel has offices in New York,…
$0
per month
Piano Analytics
Score 7.4 out of 10
Mid-Size Companies (51-1,000 employees)
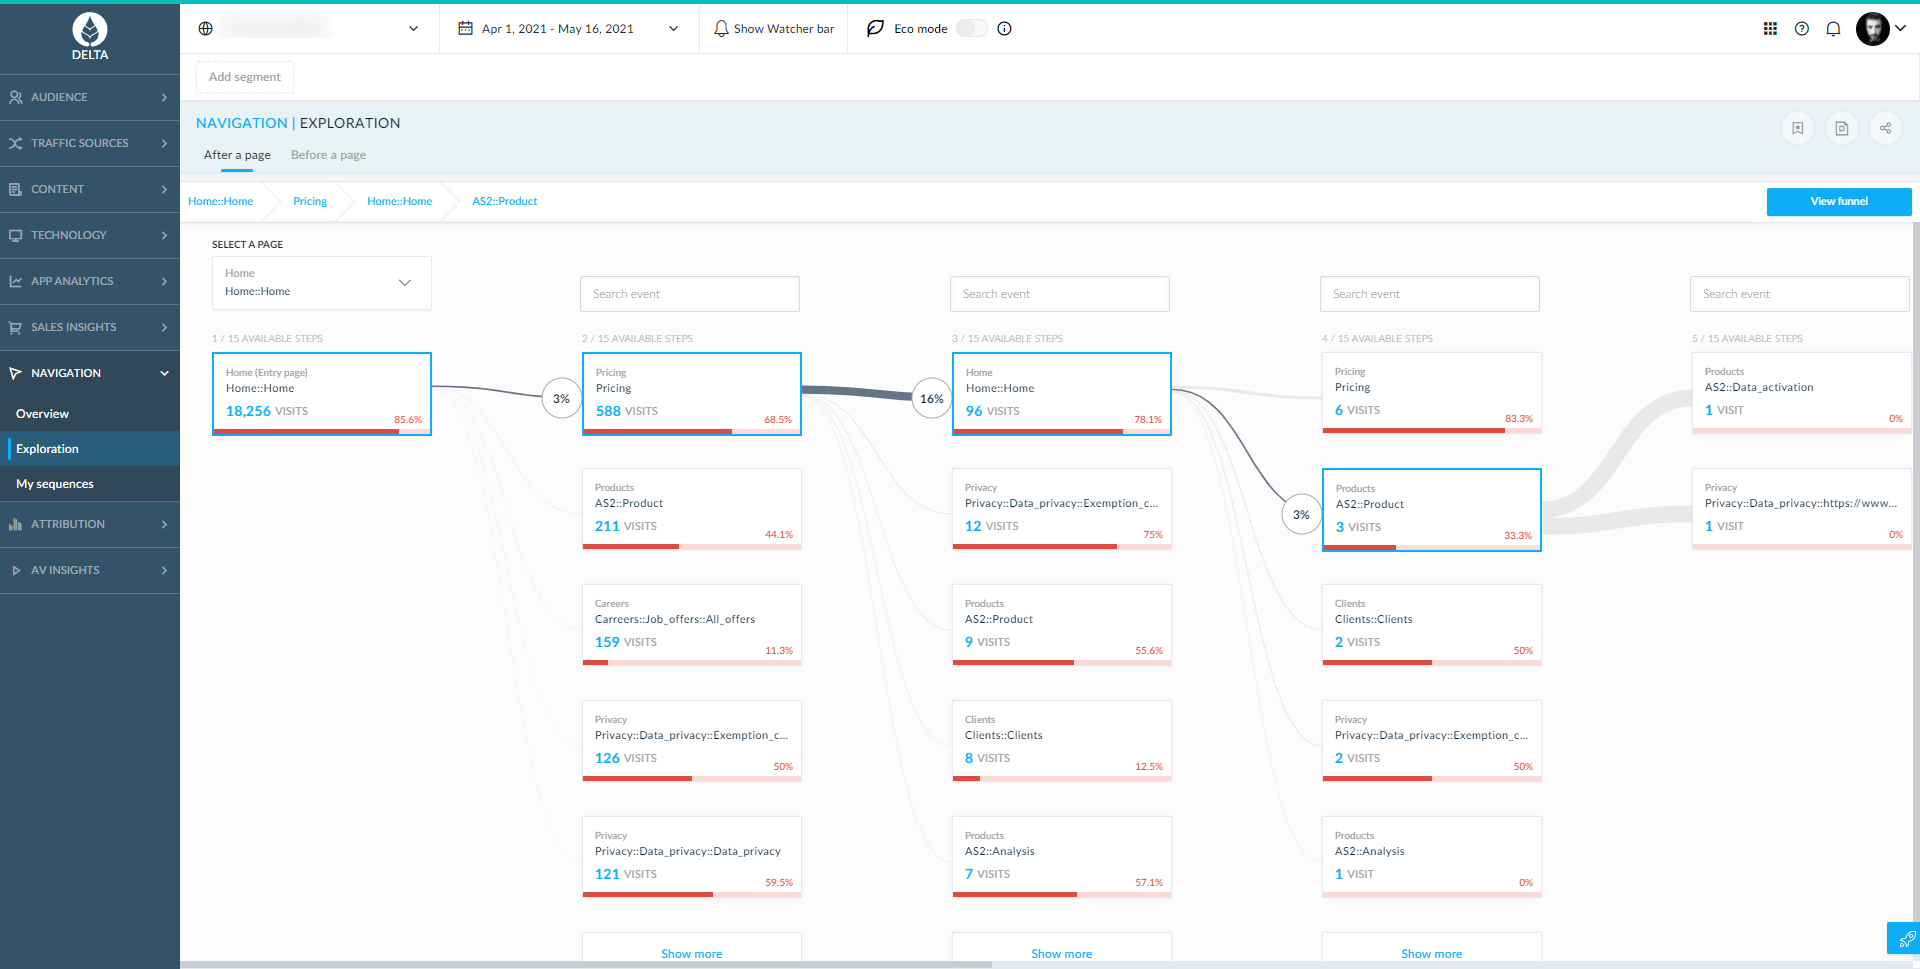
Piano Analytics, formerly AT Internet, provides digital analytics to help customers measure their audience, optimise their digital performance and create value. From data collection to exploration, activation, and the sharing of actionable insights, the Piano Analytics Suite is designed to provide reliable high-quality data to enhance decision-making company-wide. Adapted to e-commerce, media, finance/banking, and corporate websites & mobile apps, the vendor promises an easy-to-use solution…
$430
per server calls consumption
Woopra
Score 3.0 out of 10
Enterprise companies (1,001+ employees)
Woopra provides real-time customer analytics. It begins by tracking users across digital touch points (website, mobile app, help desk, marketing automation, etc.) and building a comprehensive behavioral profile for each user. These Customer Profiles are Woopra's building blocks, which are used to generate custom analytics reports, funnel analytics, retention analytics, and more.
$80
per month
Pricing
Mixpanel
Piano Analytics
Woopra
Editions & Modules
Free
$0
per month
Growth
$17
per month
Enterprise
Contact sales
Business
$430
per server calls consumption
Premium
Contact us
per server calls consumption
Pro
$999.00
per month
Offerings
Pricing Offerings
Mixpanel
Piano Analytics
Woopra
Free Trial
No
Yes
Yes
Free/Freemium Version
Yes
No
Yes
Premium Consulting/Integration Services
No
Yes
Yes
Entry-level Setup Fee
No setup fee
$430 per server calls consumption
Optional
Additional Details
Mixpanel uses MTU (Monthly Tracked User) pricing, which is designed to scale with your company. MTUs are roughly equivalent to the number of unique visitors on your product and each user is counted once per month, even if they use multiple devices. If Events based pricing makes more sense for your business, reach out to us and we can work with you!
Actually, AT internet did not stack up against other solutions. AT Internet is very expensive comparing other solutions. There are many open-sources and free tools in the market like Matomo. So we stopped to use AT Internet.
Mixpanel looks too mobile oriented. Very limited in some scenarios. Google analytics seems too B2C products oriented. More on aggregated data, retention, funnel and conversion. Woopra allows a better follow of particular users when needed.
Woopra has more flexible ways to visualize the data. Also found Woopra to be more reliable than the other analytic packages that we have used in the past. Quick turnaround when we do see a bug.
As a worker in the sales area, I see closely how complex it can be to evaluate the commercial funnel and Mixpanel has been an indispensable guide to prioritize above all what customers expect to receive from our company, and thus be able to determine the main service we offer. Without a doubt, Mixpanel has special functions to be the one that guides the route and marks the objectives much more clearly.
When it comes to web analytics AT Internet is well suited. We introduced AT Internet in 2017 after an evaluation project with other professional analytics solutions. Starting with our corporate website we quickly rolled it out to our customer experience platform, our webshops, and our corporate intranet based on SharePoint 2013. Especially the use in our intranet brought significant improvements over the standard analytics features SP 2013 is offering. The ATI tag systems with their flexibility allow us to include company-specific properties and thus making it possible for us to analyze our intranet usage on segments such as locations, branches, and so on.
My rating of Woopra is the absolute best possible. I would recommend them to anyone looking for an analytics website that prefers a visual interface and a beautiful design. I have not encountered any problems using their app -- ZERO! Their integration with other marketing software, such as MailChimp, helps our company zero in on our marketing campaigns and gives us the information we need to make better choices. I LOVE Woopra and think they are the best out there! I have used other websites and there is no comparison!
Mixpanel is a daily use application for everyone in my organization; it helps us have a better flow of information and interaction between work teams.
The user interface of this platform is simple and has a wide variety of functions and resources to help us work in the most organized way, have better team coordination, and keep efficiency high.
I love that it is so easy to program our calendar to our liking, so we can prioritize our activities and know what is pending, and the best thing is that I can update the calendar if necessary.
The chat function is great to improve the interaction between colleagues and share work schedules and any information with third parties.
Woopra tracks *individual users and customer accounts*. It cannot be understated how important this is. Google Analytics and other low cost solutions only sample users and provide aggregate data. For enterprise sales, this is critical. Likewise, for product managers trying to segment product usage by types of accounts, this is incredibly useful.
Woopra updates user analytics in real time. This is critical in a sales context as you want to be able to follow up quickly on opportunities. Likewise, it is useful for customer success as they can see usage in real time for an individual they are supporting.
Woopra has the most turnkey integrations of any web analytics solution on the market. By far the most useful are Marketo, SalesForce, and Slack, but there are several more we didn't tap into. While any solution worth its salt has an API, Woopra's integrations usually require a login and/or API key, and you are good to go. Here is the current list: https://www.woopra.com/appconnect/.
Woopra enables B2B product managers to track product and feature usage by revenue, not just clicks. Again, in a B2B context, this is critical, as there are high-value users and low-value users. Knowing the difference is critical.
Woopra's implementation is super simple. We were able to set it up with a couple of hours of one frontend developer and some help from our product intern.
Mixpanel requires an explicit setting of events from your app. This means you need to be very thoughtful in the design of your events because missing one means you aren't collecting any data from it. Inserting it into the process later on then brings challenges in tracking when certain events came online.
A tool like Mixpanel comes packed with features that sometimes are harder to discover. It's very easy to get sucked into one part of its toolset and not be aware of other tools which may be very useful.
Integrations with outside vendors: there are many ways to integrate data from outside vendors, however you can't display this information in every application unless you create a custom field, which can sometimes be limiting.
Access rights: there are two places to assign access rights and each place has slightly different functionality. You can get really granular with what each person has access to, but it is easy to miss a check box and have to go back and correct it.
Visualizations across applications: there are some really cool visualizations in the oldest application they support that includes predictive traffic estimates, automatic multi-period variations, etc., that aren't available yet in the newer applications.
It's not an all encompassing solution like Google Analytics tries to be, but MixPanel offers much easier to use and understandable data insights. That's valuable when juggling many responsibilities as startup life demands, so a renewal would be easily justified.
I gave this rating because I think that AT Internet is a good tool, user-friendly easy for onboarding and simple dashboards, however the majority of people use Google Analytics, especially media agency, it is easier for them to use Google Analytics.
We just really like the tool. There are lots of us using it internally... from Product, to marketing, to customer service, to optimization team, to traffic acquisition, to Executives. Really helps us answer questions about how well things are going, and what is not going well.
Relativity easy to use. Once you get the hang of it, very easy to create dashboards for different use cases. I split my dashboards between customers or use cases
Overall the experience is very good, it's quick, relaiable and does everything I would want. The only problems I have are matching the correct stats to what I want. It can be painful trying to find the right thing and the explanations are not always the clearest. That's the only issue i've found though.
The UI and reports are great overall. Creating reports just requires a few too many screens and clicks. Also dashboard tiles can't be resized. Both of these are easy items that are being addressed
I don't have any exemple in mind where AT Internet interface hasn't been available, i have always been able to use AT Internet when i needed it. The only issues to notice is that it happens sometimes that real time or D-1 datas are partially delayed.
We have only ever had to use their support once, when we were setting up the account, but their responses were prompt and the solutions were well documented. The people who solved our issues were helpful, even to non-tech people.
I have not used the Support Team thereby I am unable to review how their Support Teams works. However, in an instance where I had an issue, my concerned department contacted their support team and I was provided with the solution of the problem I was facing within a short span of time.
The in-person training unfortunately does not match to our expectations, was too much focus on digital basis and not on AT Internet functionnalties and how to use it. We paid for one day and only 15 minutes at the end was focused on our real needs in terms of media analytics.
Mixpanel has a great resource about their product, with videos on how to use it and real world examples from other companies on how they integrate Mixpanel into their business processes.
Again, somewhat annoying to be charged based on data points when many other analytics providers have one flat fee. Implementation was good, but I might have tracked a few more detailed points if I had the option.
Compared to other products, the support was a small effort. We only had part time contributions from a product management intern and front end developer.
AT Internet shows a deep understanding of our business objectives and provide us with ideas on how to solve them. They grant us enough time to try their tools and to be sure the tools are helpful. The data we've got in the Analyzer was manually checked and it was completely correct. Their roadmap was clean and aligned with our strategy
Woopra is much easier to setup and use than Google Analytics. I've spent hours trying to create custom reports in Google Analytics. Woopra does not take this much time to get solid reporting for our site. If you need something that tracks marketing efforts then Google Analytics will likely be a better fit.
Regarding AT Internet possibilities, it could be adapted to small or large organizations, easy to set up. We can add sites in makets that we launch e-commerce.
We've been able to increase the funnel conversions of one of our new product funnels from a 1% conversion rate to a 5% conversion rate.
We've been able to increase the CTR on another of our main product pages from ~3% to ~10% (so far)
We've been able to segment out how users from different traffic sources behave, allowing us to eliminate thousands of dollars of wasteful spending on advertising campaigns that weren't working.
Unfortunately, I do not have precise results to give, but the statistics provided by AT Internet make it possible to carry out in-depth analyses and to make good decisions.
You just have to know how to find the information and interpret it.
Really helped us begin to segment our users based on their engagement and retention.
Helped increase retention by about 1.5% after about 5 months of implementation (don't shoot the messenger if your team can't implement that quickly).
I felt like it had great potential to create a pipeline between sales and the CSM, but I had trouble getting the sales team to implement it properly as they had their noses deep in calls and emails (they struggle entering notes in SalesForces as well, so it's more a company specific problem).